เปลี่ยนสิ่งที่มองเห็น ให้เป็นตัวเลข — การคำนวณระยะ มุมร่อน และการลดระดับเพื่อการลงสนามแบบ Visual อย่างปลอดภัย
การบินแบบ Visual มักถูกเข้าใจว่าเป็น “การใช้สายตา”
แต่ในการปฏิบัติจริง โดยเฉพาะกับเครื่องบินขนาดใหญ่
สิ่งที่คุณ “เห็น” ต้องสอดคล้องกับสิ่งที่คุณ “คำนวณได้”
การลงสนามที่เสถียร ไม่ได้เกิดจากความรู้สึก
แต่เกิดจาก geometry + energy management + anticipation

1. มุมร่อน 3° — เปลี่ยน Geometry ให้เป็นระยะทาง
แนวร่อนมาตรฐานโดยทั่วไปคือ 3 องศา
จากมุมนี้ เราได้ rule of thumb ที่สำคัญมาก:
เครื่องจะลดระดับประมาณ 300 ฟุต ต่อ 1 ไมล์ทะเล (NM)
Mental Model ง่าย ๆ:
- 1 NM → ~300 ft
- 5 NM → ~1,500 ft
- 10 NM → ~3,000 ft
ตัวอย่าง:
- อยู่ที่ 3,000 ft → ควรอยู่ห่าง runway ~10 NM
- อยู่ที่ 1,500 ft → ~5 NM
- อยู่ที่ 900 ft → ~3 NM
นี่คือ distance–altitude crosscheck ที่สำคัญมาก
ถ้าความสัมพันธ์นี้ผิด
ภาพที่คุณเห็นจะ “เริ่มหลอก” ในไม่ช้า
2. Sink Rate — แปลง Ground Speed เป็นอัตราการลดระดับ
การอยู่บน glide path ไม่ใช่แค่ “ตำแหน่ง” แต่คือ “อัตรา”
Rule ที่ใช้กันทั่วไป:
Sink Rate ≈ Ground Speed ÷ 2 × 10
ตัวอย่าง:
- GS 120 kt → ~600 ft/min
- GS 140 kt → ~700 ft/min
- GS 160 kt → ~800 ft/min
ทำไมเรื่องนี้สำคัญ?
เพราะภาพที่เห็นอย่างเดียว “ไม่พอ”
- ลมต้าน (headwind) → GS ลด → sink rate ต้องลด
- ลมตาม (tailwind) → GS เพิ่ม → sink rate ต้องเพิ่ม
ถ้าไม่ปรับ
เครื่องจะค่อย ๆ หลุด glide path โดยที่คุณอาจยังรู้สึกว่า “ภาพยังโอเค”
3. การวางแผนลดระดับ — คิดย้อนจาก runway
นักบินอาชีพจะไม่รอให้ runway มาใกล้แล้วค่อยแก้
แต่จะ คิดย้อนกลับจากจุด touchdown
Rule ง่าย ๆ:
ระยะเริ่มลด (NM) ≈ ความสูงที่ต้องลด (ft) ÷ 300
ตัวอย่าง:
- ต้องลด 6,000 ft → เริ่มประมาณ 20 NM
แต่ใน visual approach:
คุณต้อง “อัปเดตตัวเลขนี้ในหัวตลอดเวลา”
Mental Loop ที่ต้องมี:
- ตอนนี้เราอยู่ที่ไหน
- บน 3° path เราควรอยู่ที่ไหน
- เรากำลังสูงหรือต่ำ (trend)
นี่คือสิ่งที่นักบินที่ดีทำ “โดยอัตโนมัติ”
4. Energy Management — ตัวแปรที่มักถูกมองข้าม
หลายครั้งที่ approach ไม่ stable
ไม่ได้เกิดจากการควบคุมไม่ดี
แต่เกิดจาก energy ไม่ถูกต้องตั้งแต่ต้น
Energy = ความเร็ว + ความสูง
สถานการณ์ที่พบบ่อย:
- สูง + เร็ว → ต้องแก้แรง (unstable risk)
- ต่ำ + ช้า → อันตรายโดยตรง
หลักสำคัญคือ:
Energy ต้องถูกตั้งแต่ต้น ไม่ใช่มาแก้ตอนท้าย

|
|
5. การผสาน Visual + Instrument + Mental Model
นักบินที่มีประสิทธิภาพจะใช้ 3 layer พร้อมกัน:
1. Visual
- การเคลื่อนของ runway
- การนิ่งของ aiming point
2. Instrument
- Vertical Speed (VSI)
- Ground Speed
- Altitude
3. Mental Model
- 300 ft/NM
- Sink rate จาก GS
- การมอง trend ล่วงหน้า
6. ภาพของ Approach ที่ดี
Approach ที่ดีจะ “รู้สึก”:
- นิ่ง
- คาดการณ์ได้
- workload ต่ำ
เพราะ:
เครื่องบิน “อยู่ในที่ที่ควรอยู่” ตั้งแต่ต้น
ไม่ใช่มาแก้ในช่วงท้าย
สรุป: Visual Flying คือ Calculated Flying
หลายคนคิดว่า visual approach คือ “ไม่ต้องแม่นมาก”
แต่ในความเป็นจริง:
Visual ที่ดี คือการบินที่ “แม่นยำจากภายใน”
คุณกำลัง:
- คำนวณระยะ
- คุม energy
- คาดการณ์ trajectory
ทั้งหมดนี้เกิดขึ้นพร้อมกับการมอง runway
และเมื่อทุกอย่างถูกต้อง—
เครื่องจะมาถูกที่ ถูกเวลา และถูกสภาวะพลังงาน
ตอนต่อไป (แนะนำ)
Visual Illusions on Approach — ทำไมตาของคุณถึงหลอกคุณได้
เช่น:
- Black hole approach
- Sloping runway
- Wide / Narrow runway illusion
ถ้าคุณต้องการ ผมสามารถทำต่อให้ทันที:
- Infographic สำหรับบทนี้ (distance vs altitude + sink rate)
- หรือทำเป็น Carousel 4–5 ภาพ สำหรับ Facebook / LinkedIn เพื่อเพิ่ม reach ได้เลย

|
|
Visual Flying Series by Capt. Sopon
Turning Visual Into Numbers — Managing Distance, Glide Path, and Descent
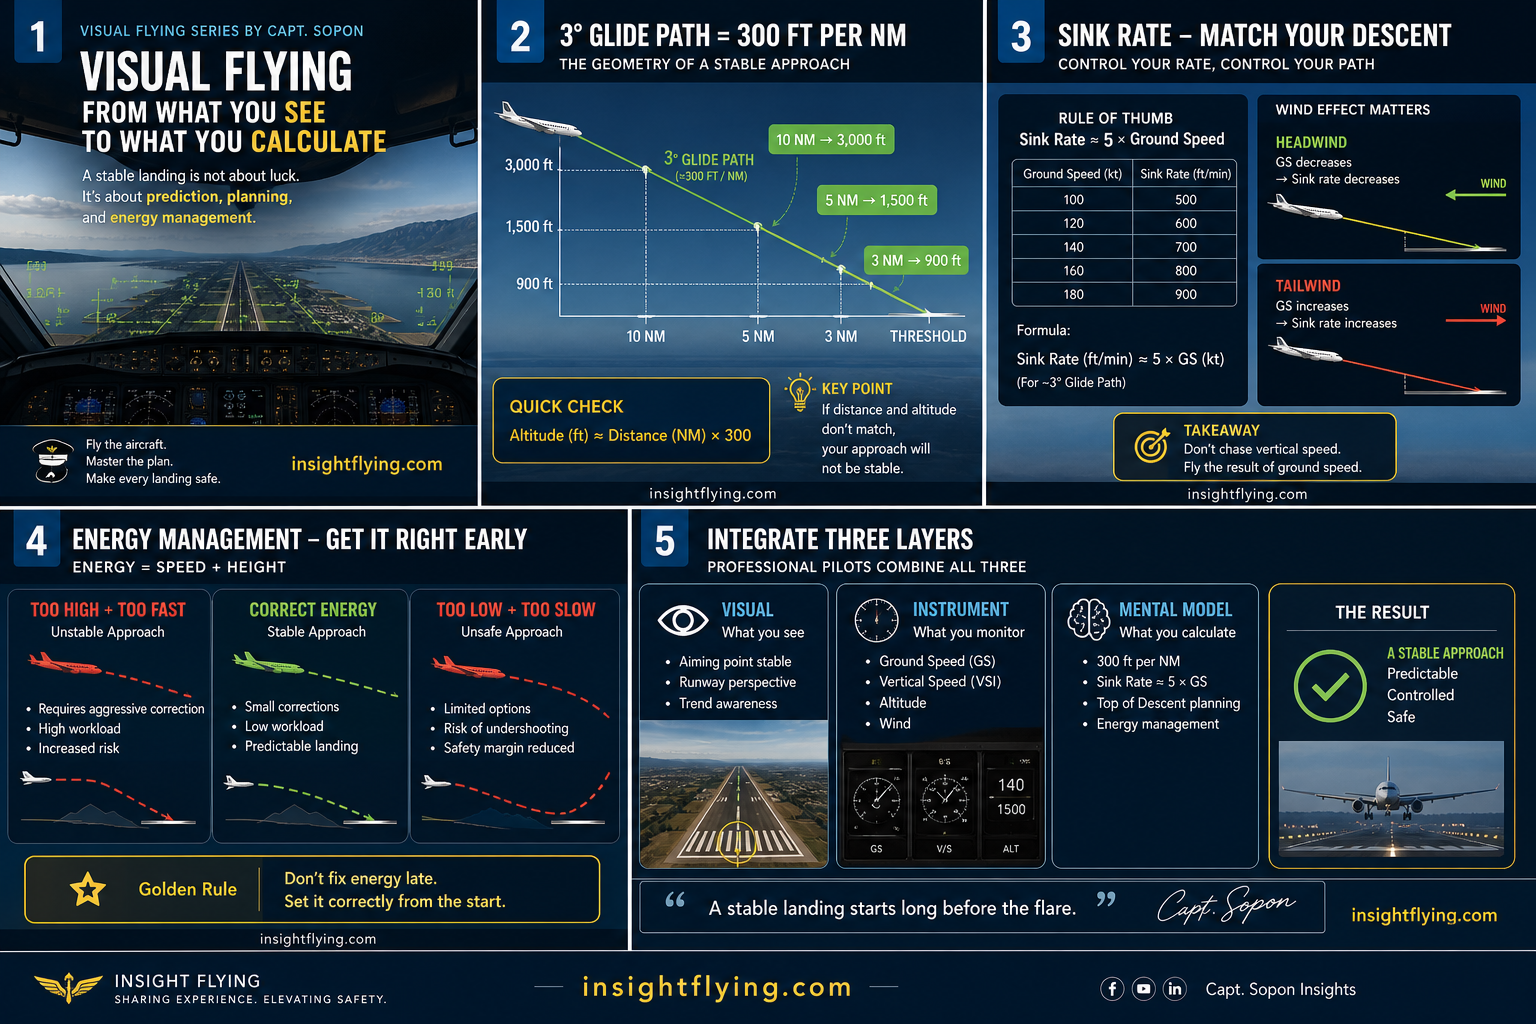
Visual flying is often described as “what you see.”
But in professional operations—especially in larger aircraft—what you see must be supported by what you can predict and calculate.
A stable visual approach is not accidental.
It is the result of geometry + energy management + anticipation.
1. The 3° Glide Path — Converting Geometry Into Distance
A standard visual (and instrument) approach is based on approximately a 3° glide path.
\tan(3^\circ) \approx 0.052
This gives us a practical rule:
You will descend ~300 ft per nautical mile
Quick mental model:
- 1 NM → ~300 ft
- 5 NM → ~1,500 ft
- 10 NM → ~3,000 ft
So if you are:
- At 3,000 ft → you should be ~10 NM from touchdown
- At 1,500 ft → ~5 NM
- At 900 ft → ~3 NM
This is your distance–altitude crosscheck.
If that relationship is off, your visual picture will soon become unstable.
2. Sink Rate — Converting Ground Speed Into Vertical Speed
A stable glide path is not just about position—it’s about rate.
For a 3° descent, a widely used operational rule is:
Sink Rate ≈ Ground Speed ÷ 2 × 10
Example:
- GS 120 kt → ~600 ft/min
- GS 140 kt → ~700 ft/min
- GS 160 kt → ~800 ft/min
More precisely:
\text{Sink Rate} \approx 5 \times \text{Ground Speed (kt)}}
This approximation aligns closely with a 3° path.
Why this matters:
Because visual illusion alone is not enough.
- Headwind → lower ground speed → lower required sink rate
- Tailwind → higher ground speed → higher sink rate required
If you don’t adjust, the aircraft will drift off glide path even if the picture initially looks correct.
3. Descent Planning — Think Backwards From the Runway
Professional pilots don’t “react” to the runway—they plan backward from it.
Rule of thumb:
Top of Descent (NM) ≈ Altitude to lose (ft) ÷ 300
Example:
- Need to lose 6,000 ft → start descent ~20 NM out
But for visual flying:
You must continuously update this mentally during the approach.
Key mental loop:
- Where am I now?
- Where should I be on a 3° path?
- Am I trending high or low?
This loop runs constantly—even in visual conditions.
4. Energy Management — The Missing Link
Many unstable approaches are not caused by poor flying, but by poor energy control.
Energy = Speed + Height
If you are:
- Fast and high → requires aggressive correction (unstable risk)
- Slow and low → safety risk
A stable visual approach requires:
Energy to be correct early—not fixed late
5. Integrating Visual + Instrument + Mental Model
The most effective pilots combine three layers:
1. Visual
- Runway movement
- Aiming point stability
2. Instrument
- VSI (vertical speed)
- Ground speed
- Altitude
3. Mental Model
- 300 ft/NM rule
- GS-based sink rate
- Trend awareness
“Dark Side of Aviation” is available in Apple Books

6. What Good Looks Like
A well-managed visual approach will feel:
- Predictable
- Stable
- Low workload
Because:
The aircraft is already where it should be—no last-minute correction required.
Conclusion: Visual Flying Is Calculated Flying
Visual approaches are often misunderstood as “less precise.”
In reality:
The best visual flying is deeply structured, highly predictive, and mathematically supported.
You are not just “seeing the runway.”
You are:
- Calculating distance
- Managing energy
- Predicting trajectory
All in real time.
And when done correctly—
The aircraft arrives at the right place, at the right time, with the right energy.
Suggested Next Episode
“Visual Illusions on Approach — Why Your Eyes Can Mislead You”
(เช่น black hole approach, sloping runway, wide/narrow runway illusion)
ยอดเยี่ยมครับ—หัวข้อนี้จะช่วย “เชื่อม” จาก Visual Pattern ไปสู่ quantitative flying ได้อย่างสมบูรณ์ ผมร่างให้ในสไตล์บทความต่อเนื่องสำหรับซีรีส์ของคุณ:
Visual Flying Series by Capt. Sopon
Turning Visual Into Numbers — Managing Distance, Glide Path, and Descent
Visual flying is often described as “what you see.”
But in professional operations—especially in larger aircraft—what you see must be supported by what you can predict and calculate.
A stable visual approach is not accidental.
It is the result of geometry + energy management + anticipation.
1. The 3° Glide Path — Converting Geometry Into Distance
A standard visual (and instrument) approach is based on approximately a 3° glide path.
\tan(3^\circ) \approx 0.052
This gives us a practical rule:
You will descend ~300 ft per nautical mile
Quick mental model:
- 1 NM → ~300 ft
- 5 NM → ~1,500 ft
- 10 NM → ~3,000 ft
So if you are:
- At 3,000 ft → you should be ~10 NM from touchdown
- At 1,500 ft → ~5 NM
- At 900 ft → ~3 NM
This is your distance–altitude crosscheck.
If that relationship is off, your visual picture will soon become unstable.
2. Sink Rate — Converting Ground Speed Into Vertical Speed
A stable glide path is not just about position—it’s about rate.
For a 3° descent, a widely used operational rule is:
Sink Rate ≈ Ground Speed ÷ 2 × 10
Example:
- GS 120 kt → ~600 ft/min
- GS 140 kt → ~700 ft/min
- GS 160 kt → ~800 ft/min
More precisely:
\text{Sink Rate} \approx 5 \times \text{Ground Speed (kt)}}
This approximation aligns closely with a 3° path.
Why this matters:
Because visual illusion alone is not enough.
- Headwind → lower ground speed → lower required sink rate
- Tailwind → higher ground speed → higher sink rate required
If you don’t adjust, the aircraft will drift off glide path even if the picture initially looks correct.
3. Descent Planning — Think Backwards From the Runway
Professional pilots don’t “react” to the runway—they plan backward from it.
Rule of thumb:
Top of Descent (NM) ≈ Altitude to lose (ft) ÷ 300
Example:
- Need to lose 6,000 ft → start descent ~20 NM out
But for visual flying:
You must continuously update this mentally during the approach.
Key mental loop:
- Where am I now?
- Where should I be on a 3° path?
- Am I trending high or low?
This loop runs constantly—even in visual conditions.
4. Energy Management — The Missing Link
Many unstable approaches are not caused by poor flying, but by poor energy control.
Energy = Speed + Height
If you are:
- Fast and high → requires aggressive correction (unstable risk)
- Slow and low → safety risk
A stable visual approach requires:
Energy to be correct early—not fixed late
5. Integrating Visual + Instrument + Mental Model
The most effective pilots combine three layers:
1. Visual
- Runway movement
- Aiming point stability
2. Instrument
- VSI (vertical speed)
- Ground speed
- Altitude
3. Mental Model
- 300 ft/NM rule
- GS-based sink rate
- Trend awareness
6. What Good Looks Like
A well-managed visual approach will feel:
- Predictable
- Stable
- Low workload
Because:
The aircraft is already where it should be—no last-minute correction required.
Conclusion: Visual Flying Is Calculated Flying
Visual approaches are often misunderstood as “less precise.”
In reality:
The best visual flying is deeply structured, highly predictive, and mathematically supported.
You are not just “seeing the runway.”
You are:
- Calculating distance
- Managing energy
- Predicting trajectory
All in real time.
And when done correctly—
The aircraft arrives at the right place, at the right time, with the right energy.
หนังสือ A Pilot Books ในรูปแบบ eBook ที่ MebMarket
สร้างแรงบันดาลใจ…..เริ่มเมื่อไหร่


|
|
|
|
|

|
|

|
|


|
|